
Chart Echo
Chart Echo uses historical pattern matching to show how similar charts performed before, giving you data-driven precedent for your current setup.
Visit
About Chart Echo
Chart Echo is a specialized market analysis tool that leverages historical pattern matching to help traders and investors study how similar chart setups have performed in the past. Instead of relying on subjective analysis or technical indicators, Chart Echo searches through approximately 450 million historical windows across stocks and cryptocurrencies to find chart patterns that closely resemble the one you are currently watching. The core value proposition is straightforward: the tool identifies historical moments where the market looked like it does today, overlays those past matches on your current chart in gold, and then shows you how those matches continued after the match point. This gives you a data-grounded picture of the odds, including how often similar setups rose, fell, or went nowhere, the average move, and the typical drawdown along the way. Chart Echo is designed for active traders who want to see historical analogs before taking a setup, long-term investors who want to sanity-check breakouts or sell-offs against decades of precedent, and crypto watchers who know that crypto markets tend to rhyme with their own past structures. The tool is free to start with no account required, and it provides a clean, guided flow that eliminates guesswork and noise. It is not a prediction tool and does not offer financial advice; instead, it organizes the market's own memory so you can study precedent in seconds.
Features of Chart Echo
Massive Historical Database
Chart Echo searches through roughly 450 million historical windows across stocks and cryptocurrencies. This extensive database covers decades of market data, ensuring that when you run a pattern match, the tool can find the closest historical analogs from a vast range of market conditions, timeframes, and asset classes. The sheer volume of data increases the statistical relevance of the matches.
One-Click Pattern Matching
You do not need to configure any indicators, write scripts, or set up complex scanners. Simply pick a stock or crypto ticker, set the timeframe and the number of candles that define your pattern, and run the search. Chart Echo instantly returns a ranked list of historical echoes, each with a match strength score and an explanation of why the pattern rhymes.
Historical Overlay and Outcome Statistics
For each historical match, Chart Echo overlays the past pattern in gold directly onto your current chart. More importantly, it shows you what happened next. You get aggregated continuation data that includes the average move, the typical drawdown, and the probability of the setup rising, falling, or going nowhere. This gives you an honest, data-driven view of the odds.
Guided Five-Step Workflow
Chart Echo provides a single, guided path from start to finish. The workflow consists of five clear steps: pick the market, frame the pattern, review the matches, overlay an echo and read the outcome statistics, and then act by saving the workspace, setting a reminder, or sharing a Story GIF. This eliminates the blank canvas problem and makes the tool accessible to both beginners and experienced traders.
Use Cases of Chart Echo
Pre-Trade Setup Validation for Active Traders
Before taking a trade, an active trader can use Chart Echo to see the closest historical analogs for the current chart pattern. By reviewing how those analogs resolved over the following days and weeks, the trader can assess the odds of success, the typical drawdown to expect, and the average move. This allows for more informed risk management and trade planning.
Long-Term Investment Sanity Check
A long-term investor observing a breakout or a significant sell-off can use Chart Echo to sanity-check the move against decades of market precedent. Instead of relying on a single analyst's opinion or gut feeling, the investor can see how similar structural patterns played out historically. This provides a broader, data-based context for making hold, buy, or sell decisions.
Crypto Market Pattern Recognition
Crypto markets are known for repeating structural patterns. A crypto trader can match Bitcoin, Ethereum, or other major cryptocurrencies against their own past structures or even across different assets. Chart Echo helps identify when a current consolidation, breakout, or capitulation event has a strong historical analog, providing a statistical basis for anticipating potential future moves.
Educational Study of Market Rhymes
Newer traders and students of market behavior can use Chart Echo as an educational tool. By running pattern matches on various setups, they can learn how certain chart formations have historically resolved. This builds an intuitive understanding of market cycles, pattern probabilities, and the concept that markets often rhyme, without needing to manually scroll through years of historical charts.
Frequently Asked Questions
What exactly does Chart Echo do?
Chart Echo searches a database of roughly 450 million historical chart windows to find patterns that closely match the stock or crypto chart you are currently viewing. It then overlays those historical matches on your current chart and shows you how they performed after the match point. The output includes aggregated statistics like average move, typical drawdown, and the probability of the setup going up, down, or sideways.
Is Chart Echo a prediction tool or financial advice?
No. Chart Echo is explicitly not a prediction tool and does not provide financial advice. It is a historical pattern matching tool that organizes the market's own memory. The results show you what has happened in the past under similar conditions, but past performance does not guarantee future results. The tool is designed to help you study precedent, not to tell you what will happen next.
Do I need to create an account to use Chart Echo?
No, you can try Chart Echo for free without signing up. A free tier allows you to access the core pattern matching functionality. Creating an account unlocks the ability to save your workspaces for later review. A premium tier adds additional features such as Pro Mode, saved-setup reminders, intraday timeframes, alerts, and watermark-free exports.
What markets and timeframes are supported?
Chart Echo supports both stocks and cryptocurrencies. The database covers a vast range of historical data across these asset classes. The tool allows you to set the timeframe and the number of candles that define your pattern. Premium users gain access to intraday timeframes, while the free version likely focuses on daily and higher-level timeframes.
Similar to Chart Echo
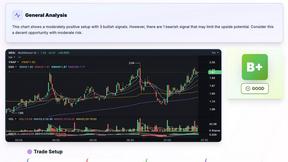
SnapPChart
SnapPChart grades a trading chart screenshot A+ to F, with an entry, stop, targets, and risk/reward. Works on stocks, forex, crypto, futures.

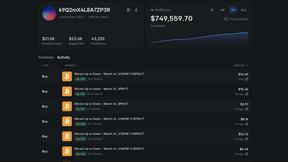
Polymarket Trading Bot For Crypto
Automate high-frequency arbitrage and directional trading on Polymarket's 5-15 minute crypto markets with a transparent, locally-run bot replicating.